Briefly Balanced
Modular realignment of entorhinal grid cell activity as a basis for hippocampal remapping
Monaco JD and Abbott LF. (2011). Modular realignment of entorhinal grid cell activity as a basis for hippocampal remapping. Journal of Neuroscience, 31(25), 9414–9425. doi: 10.1523/jneurosci.1433-11.2011
Related to: Monaco JD. (2009). Models and mechanisms for integrating cortical feature spaces. Ph.D. Dissertation, Columbia University. ProQuest Publication No. AAT 3393609. [original]
Abstract
Hippocampal place fields, the local regions of activity recorded from place cells in exploring rodents, can undergo large changes in relative location during remapping. This process would appear to require some form of modulated global input. Grid-cell responses recorded from layer II of medial entorhinal cortex in rats have been observed to realign concurrently with hippocampal remapping, making them a candidate input source. However, this realignment occurs coherently across colocalized ensembles of grid cells (Fyhn et al., 2007). The hypothesized entorhinal contribution to remapping depends on whether this coherence extends to all grid cells, which is currently unknown. We study whether dividing grid cells into small numbers of independently realigning modules can both account for this localized coherence and allow for hippocampal remapping. To do this, we construct a model in which place-cell responses arise from network competition mediated by global inhibition. We show that these simulated responses approximate the sparsity and spatial specificity of hippocampal activity while fully representing a virtual environment without learning. Place-field locations and the set of active place cells in one environment can be independently rearranged by changes to the underlying grid-cell inputs. We introduce new measures of remapping to assess the effectiveness of grid-cell modularity and to compare shift realignments with other geometric transformations of grid-cell responses. Complete hippocampal remapping is possible with a small number of shifting grid modules, indicating that entorhinal realignment may be able to generate place-field randomization despite substantial coherence.
Simulated grid→place transformation: Place-field maps strongly depend on plasticity and excitatory/inhibitory circuit architecture
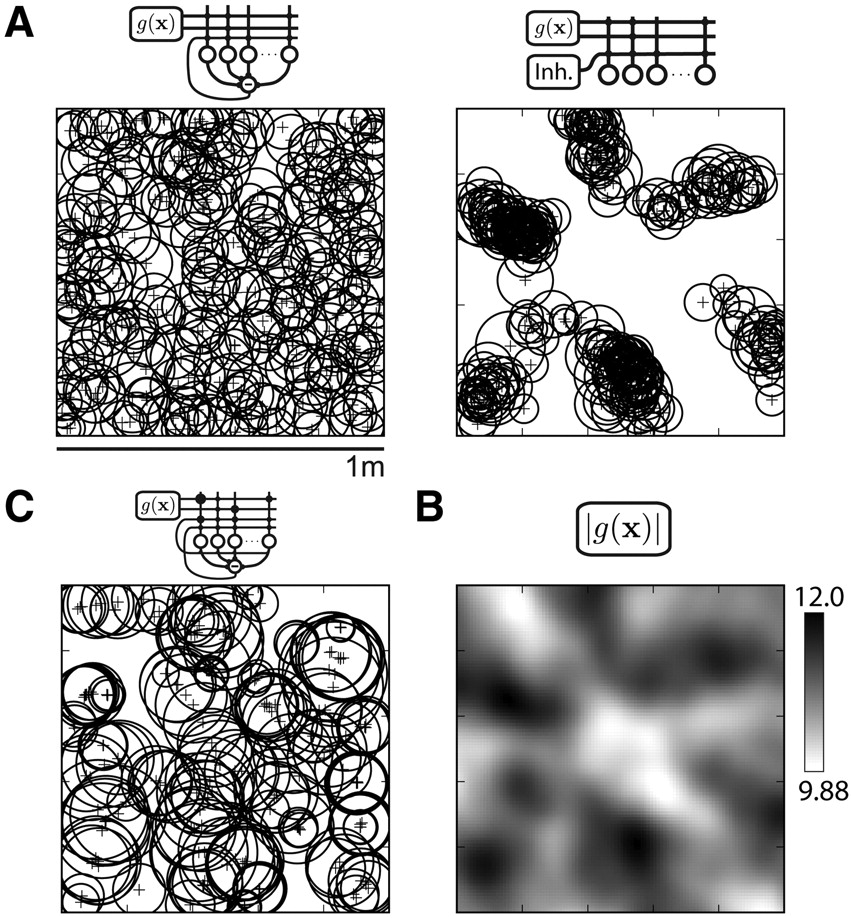
Comparison of place-field distributions generated by variants of the recurrent inhibition model. All place fields in a simulation are shown schematically (A, C) as a circle of equivalent diameter and plus sign centered at field center-of-mass. Simulations are derived from the same grid population and place-cell network shown in Figure 1. A, The recurrent inhibition model (left) is compared with a feedforward inhibition model (right). The feedforward activity threshold was chosen to match the network sparsity (192 of 500 units active) of the recurrent simulation. Unlike the recurrent model output, place fields in the feedforward model are distributed unevenly in several clusters across the environment. B, The population vector magnitude |g(x)| of grid-cell activity shows relative peaks that match the locations of the place-field clusters in the feedforward output (A, right). C, The recurrent inhibition model is extended with associatively modified grid-place connections and recurrent excitation among the place units (for details, see Results, Alternative place-cell models). The spatial map is sparser (114 of 500 units active) and place fields larger (mean, 325 cm2) than the recurrent inhibition model (A, left) (Table 1; Fig. 2B). Place fields formed local clusters: 103 of 113 units active in A (left) and C shifted peak firing <10 cm.
Post-Publication Reviews
- [F1000 “Very Good” Rating] Giocomo L and Moser E. (June 29, 2011). “This paper presents an interesting computational model which utilizes grid-cell modularity to generate robust remapping…” F1000Prime/Faculty Opinions.
- [Reviewed by] Giocomo L, Moser M-B, and Moser E. (2011). Computational Models of Grid Cells. Neuron, 71(4), 589–603. doi: 10.1016/j.neuron.2011.07.023
Source Code
- The python code package that was used for all simulation and analysis is available at the Yale SenseLab ModelDB repository
Supplemental Material
- All Figures
- Figure S1: Place network competition was studied on a 16-by-16 grid of inhibitory strength J and threshold λ. Parameter dependence for all measured spatial coding properties is shown (including those shown in Figure 4 of the paper).
- Figure S2: We found high correlations between the rasterized trajectories used throughout the paper and naturalistic random-walk trajectories in the environment defined by the same grid-cell configuration.
- Figure S3: The modular realignments shown in Figure 5 produce differing effects on the distribution of excitatory input strength (measured as the magnitude of the grid-cell population response vector) across the environment.
- Figure S4: For the same data as shown in Figure 6C, which presents just the pair-wise remapping measure, the activity turnover is shown here.
- Figure S5: The remapping and turnover trends for the sample sets based on frequency modules are shown. This is directly analogous to the data for random modules shown in Figure 7A, and is the basis of the comparisons performed in Figure 7B-C.
