Briefly Balanced
Spatial synchronization codes from coupled rate‑phase neurons
Monaco JD, De Guzman RM, Blair HT, and Zhang K. (2019). Spatial synchronization codes from coupled rate‑phase neurons. PLOS Computational Biology, 15(1), e1006741. doi: 10.1371/journal.pcbi.1006741
- Full Text
- Supporting Information
- Source Code: doi: 10.6084/m9.figshare.6072317
- Preprocessed dataset: doi: 10.17605/osf.io/psbcw
- Related to: Monaco JD, Knierim JJ, and Zhang K. (2011). Sensory feedback, error correction, and remapping in a multiple oscillator model of place cell activity. Frontiers in Computational Neuroscience, 5:39. doi: 10.3389/fncom.2011.00039
Summary
Spatial cognition in mammals depends on position-related activity in the hippocampus and entorhinal cortex. Hippocampal place cells and entorhinal grid cells carry distinct maps as rodents move around. The grid cell map is thought to measure angles and distances from previous locations using path integration, a strategy of internally tracking self motion. However, path integration accumulates errors and must be ‘reset’ by external sensory cues. Allowing rats to explore an open arena, we recorded spiking neurons from areas interconnected with the entorhinal cortex, including subcortical structures and the hippocampus. Many of these subcortical regions help coordinate the hippocampal theta rhythm. Thus, we looked for spatial information in theta-rhythmic spiking and discovered ‘phaser cells’ in the lateral septum, which receives dense hippocampal input. Phaser cells encoded the rat’s position by shifting spike timing in symmetry with spatial changes in firing rate. We theorized that symmetric rate-phase coupling allows downstream networks to flexibly learn spatial patterns of synchrony. Using dynamical models and simulations, we showed that phaser cells may collectively transmit a fast, oscillatory reset signal. Our findings develop a new perspective on the temporal coding of space that may help disentangle competing models of path integration and cross-species differences in navigation.
Example data: A “phaser cell” recorded in the lateral septum reveals an allocentric spatial rate-phase correlation
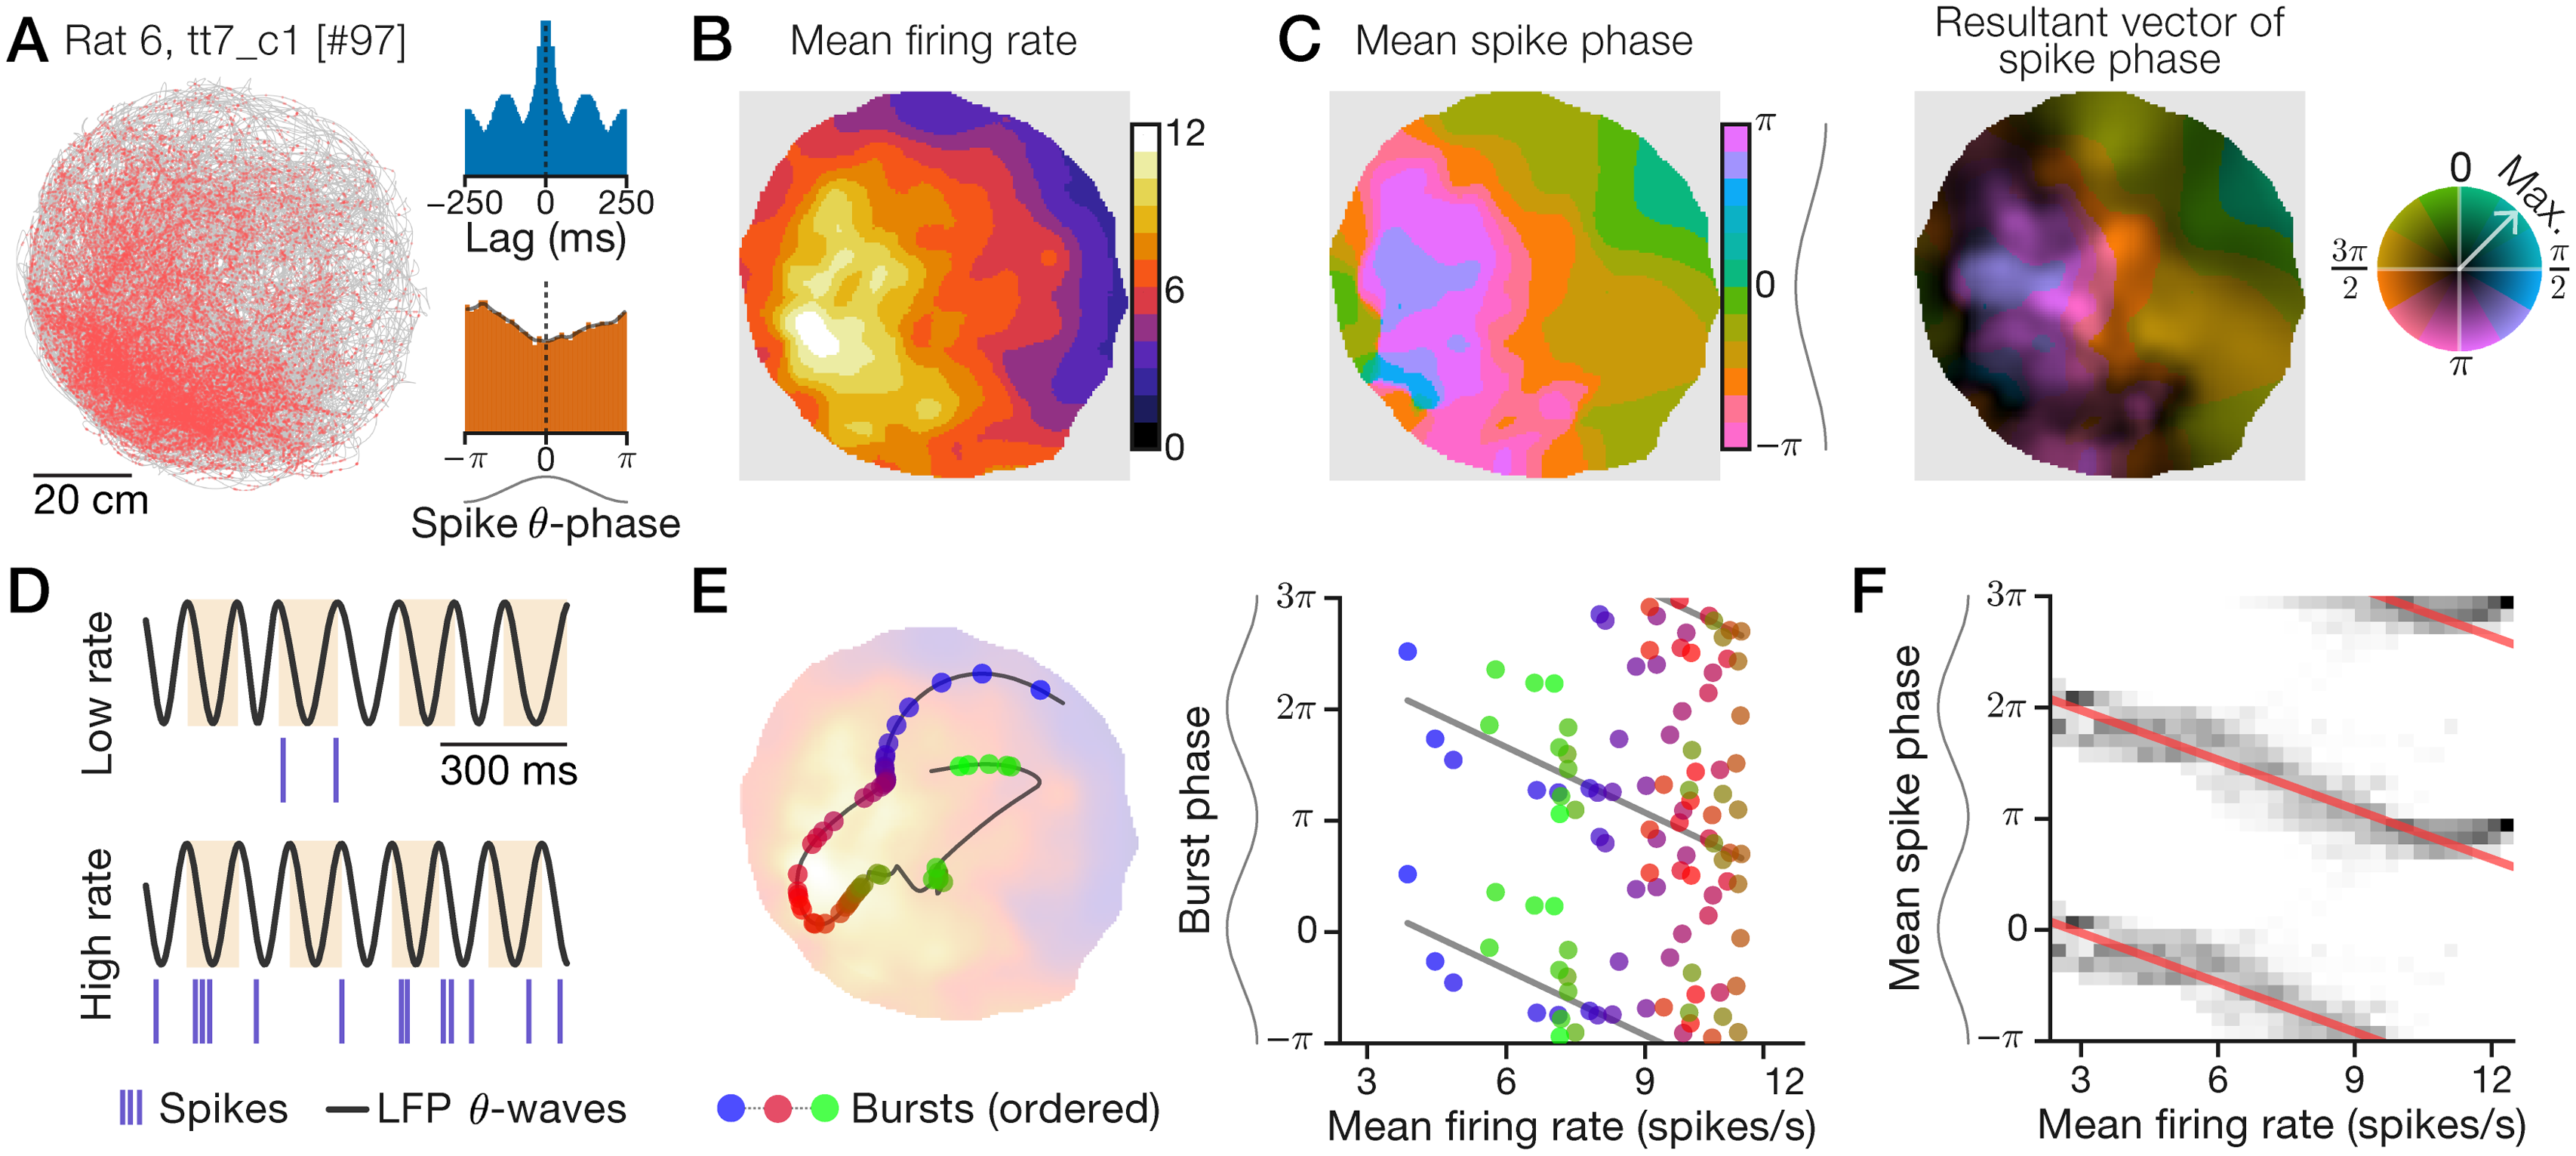
Recording data for a lateral septal neuron during a 2.2-h session in an 80-cm diameter arena. Sinusoids aligned to phase axes indicate theta waves, with peaks oriented to the top (horizontal axes) or left (vertical axes). A, Spike-trajectory plot. Red dots: animal position at time of spike; gray line: trajectory. Inset: spike train autocorrelogram (top) and spike theta-phase distribution (bottom). B+C, Spatial maps computed with an adaptive Gaussian kernel (Methods). B, Firing ratemap. C, Spike mean-phase map (left) and phase-vector map (right) with normalized MVL indicated by color saturation (color wheel; Methods). D, Example 1-s traces of hippocampal LFP theta waves and spikes during periods of low (top) or high (bottom) firing rate. Highlights show theta cycles. E, Example 15-s trajectory segment (line) showing bursts (circles) emitted as the rat traveled from a low-rate region to a high-rate location (blue-to-red bursts) and back to a low-rate region (red-to-green bursts; left). Likewise, plotted against firing rate, burst phase first advanced (blue-to-red bursts) and then delayed (red-to-green bursts; right). Left background: ratemap from B. F, Mean-phase (C) distributions (grayscale) conditioned on mean rate (B). Red lines: circular-linear regressions; multiple theta cycles shown (y-axis) for clarity.
Model simulation: Downstream “target burster” neurons simultaneously learned 2D spatial phase-grating codes for all preferred directions
Competitive 2D open-field phaser entrainment across preferred direction: Phase 2. The spatial phase codes in Fig 8B have a 45° preferred direction, which determines the angular orientation of the VCO-like phase code. Here we show a movie in which the frames iterate through 64 units in the Phase 2 collection of target bursters (S10 Fig, panel B, green) that were simulated with a 600-s behavioral trajectory. The supervised phase code (top left) rotates smoothly for a complete cycle, allowing the video to be looped. With this phase offset (π, at the center of the arena), the positive phasers synchronized a boundary region (blue/green) along the preferred direction. (top right) Space-phase distribution of the total phaser network input to the target burster. (bottom left) Burst phase map of target burster output.
